From pv magazine USA
NREL says in a new report that there is strong global demand for PV. China remains the frontrunner for solar deployment, growing its installations by 57% year on year in 2022, representing 42% of global demand. Most of China’s installations are smaller distributed projects, rather than large, centralized utility-scale projects, said the International Energy Agency. NREL says analysts expect global installations to reach 300 GW this year and 400 GW by 2025.
In the United States, PV represented about 46% of new electricity generation capacity additions in 2022. Yet solar has a long way to grow to play its part as a core technology in the energy transition. PV represents 9% of net summer capacity and 4.7% of annual generation in 2022, said NREL.
California has made the longest strides in solar, with 27.3% of its electricity generation being sourced from solar. Solar has at least a 5% share in the generation mix in 16 states as of the end of 2022.
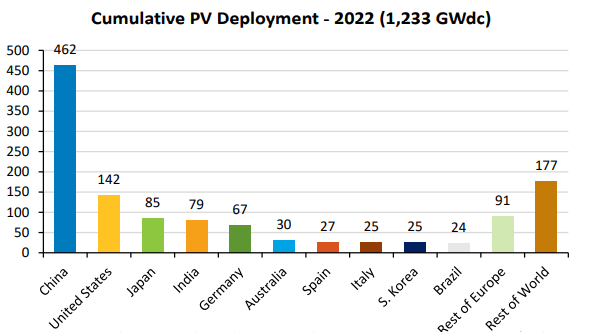
Cumulatively, the U.S. has installed 140 GWdc of solar, representing a little over 10% of global installations. The U.S. represents about 17% of global electricity generation. In 2022, the nation added 20.2 GWdc of solar, said NREL, though the American Clean Power Association (ACP) places that number at 25.5 GWdc, representing the third largest year for solar deployment. This was a 15% slowdown in installations from 2021, largely due to project delays resulting from component supply issues.
Energy storage across the U.S. added 14.1 GWh, 4.8 GW of energy storage, leading to an average duration of about 3 hours. Batteries and other forms of storage are being used in a variety of ways, from short-duration peaker plants supplanting new natural gas peakers, to longer-duration storage to match the intermittent cycle of solar generation.
Pricing
Utility-scale PV systems in the U.S. increased in prices to $1.49 per Wac, rising 13% year-over-year. The lowest and highest reported prices in 2022 were $1.06 per Wac and $2.10 per Wac, respectively.
Residential system prices increased as well, though slower, at about 6.3% year-over-year, with a median price of $2.85 per Wdc, per EnergySage.
Prices changes varied by project sizes. In a sample of projects from major markets Arizona, California, Massachusetts and New York, prices changed as follows:
- Increased 5% to $4.40/Wdc for systems 2.5 to 10 kW
- Increased 9% to $3.92/Wdc for systems 10 to 100 kW
- Increased 4% to $2.59/Wdc for systems 100 to 500 kW
- Increased 13% to $2.08/Wdc for systems 500 kW to 5 MW
Global polysilicon reached an 18-month low in January of $20 per kg, rebounding to $30 per kg in mid-February, and then dropping to $24 per kg by mid-April 2023.
Module prices have fallen to a two-year low globally in April 2023, declining steadily since fall 2022 despite strong demand. In the first two months of 2023, average U.S. module prices were $0.36 per Wdc, down 11% quarter-over-quarter. Modules traded at a 57% premium over the global spot price for monofacial monocrystalline silicon modules.
The solar PV experience curve, known as Swanson’s Law, displays the relationship, in logarithmic form, between the average selling price of a solar module and the cumulative global shipments of modules. For every doubling of cumulative PV shipments from 1976 to 2022, there has been on average of a 22% reduction in module prices, said NREL.
Manufacturing
Global solar shipments increased sharply in 2022, rising 46% over the 2021 total, reaching 283 GW. Most of the shipments, 96%, were monocrystalline silicon panels, up from 35% in 2015. N-Type modules are increasing in share, representing 51%, up from about 20% in 2020 and only 5% in 2019.
“Via higher open-circuit voltage values, you can achieve higher efficiencies and power ratings. In and of itself, that is likely going to move manufacturers to n-type TOPCon cell designs, as soon as they can get there,” said Kenneth Sauer, principal engineer, VDE Americas.
In 2022, the U.S. produced about 5 GW of solar modules, though that number is expected to grow significantly as the Inflation Reduction Act has attracted strong global and domestic investment in manufacturing solar components in the U.S. ACP said the $369 billion spending package has already attracted $150 billion in private investments, leading to 46 new manufacturing facilities or significant capacity upgrades.
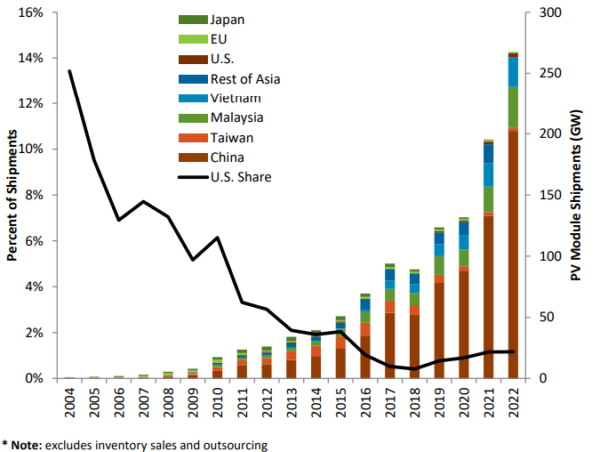
While the U.S. is betting big on domestic manufacturing, it today relies heavily on imports. According to U.S. Census data, 28.7 GWdc of modules and 2.5 GWdc of cells were imported in 2022, a growth of 21% year over year. Malaysia, Vietnam, Cambodia, and Thailand represented 73% of all module imports, placing significant importance on the ongoing policy battle over President Joe Biden’s moratorium on solar tariff imports from the four nations.
In 2022, only 10%, or about 2.7 GWdc, of modules reported a tariff, compared to 56% (13.2 GWdc) in 2021, said NREL.
This content is protected by copyright and may not be reused. If you want to cooperate with us and would like to reuse some of our content, please contact: editors@pv-magazine.com.


Sir, how to start small industry in India for manufacturing solar cell
From precision industries
Secundrabad
29 chandra nagar colony Rasoolpura
Telangana India 500003