From pv magazine print edition 10/24
Prices for solar modules have fallen rapidly since September 2023. In Europe, mainstream solar modules reached values of around €0.14 ($0.23)/W of generation capacity in December 2023, compared to around €0.30/W at the beginning of that year. In 2024, prices have only continued to fall, including for the highest-performing products.
Despite the downward trend, the figures still represent considerable turnover. In Germany alone, assuming an average value of €0.24/W, €3.6 billion of solar modules were sold to end customers by wholesalers in 2023, including their price mark-ups. This resulted in nearly 15 GW of solar generation capacity installed nationwide.
That high capacity and revenue, combined with the fact that Germany accounted for just under 4% of the global solar market in 2023, should be considered when reviewing the statistical evaluation by CalLab PV Modules at the Fraunhofer Institute for Solar Energy Systems (ISE) in Freiburg, Germany. The resulting document, “Nominal power of PV modules compared to measured power in the calibration laboratory: Is there an increasing trend towards excessive nominal power?” revealed clear indications that the power specifications stated on module nameplates tend to be too high.
Daniel Philipp, head of the module characterisation and reliability department and manager of the test and calibration lab at Fraunhofer ISE, along with his colleagues Martin Kaiser and Ulli Kräling, have analyzed approximately 68,500 module power measurements taken since 2012. The researchers carefully removed data that could distort the results. For example, they excluded modules with unknown serial numbers and multiple measurements of the same specimens, such as those from aging tests. Only modules with crystalline silicon solar cells were included, leaving 6,349 data points.
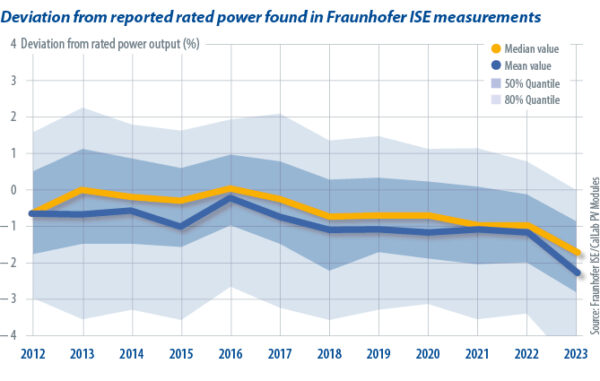
The results showed that from 2012 to 2016, there were indeed differences between the reported nominal outputs and the results determined by Fraunhofer ISE, but the difference on average was less than 1%. In 2016, the average deviation between manufacturer-specified power output and the output measured by Fraunhofer ISE was 0.4%. Since then, the rate of deviation has grown by 1.8 percentage points. In 2023, the average deviation was 2.2%. In fact, 80% of the evaluated data points were in a range of up to around 4% negative deviation. Positive deviations – when the power measured at ISE is higher than accounted for – were virtually nonexistent in 2023, despite being common in the past (see chart below). In other words, customers would get less for the same nominal power that they purchase.
Surprised inquiries
If those results are applied to solar module sales in Germany, it means that an estimated €80 million to €140 million may have been overpaid in the wholesale sector. In terms of the global market, that would result in a shortfall of several billion euros. Or a gain – that’s a question of perspective.
If the stated rated output for any given module is 2% higher than the actual value, that means 8 W for a 400 W module, and 12 W for a 600 W module.
Manufacturers usually sell their products in power rating increments of 5 W because for technical reasons it’s not possible to manufacture modules with exactly the same output in series production. This means they are measured in the factory with a solar simulator, or flasher, and then divided into corresponding classes according to watt output – for example, from 405 W to 410 W, or 415 W and 420 W to 425 W. A positive tolerance is customary here, at least with renowned manufacturers: 400 W or more have to be measured for a module declared as 400 W. However, if there is a deviation of 2% or more, a module then slips into the 405 W or even 410 W category.
It could be argued that the enormous price drop for solar panels in the past year has significantly reduced any mismeasurement problems in practice. However, apart from misstated output being a matter of principle, solar installers could face problems. After all, they often calculate an expected solar power yield for their customers and the reference value for this calculation is a panel’s rated output. Solar installers are also the first port of call for customers when it comes to performance guarantees. If modules deliver 2% to 4% less than promised right from the start, inspections carried out after a few years of operation will lead to more frequent complaints.
Big customers, especially developers of large-scale solar projects, routinely carry out their own testing and send random samples to a test laboratory such as Fraunhofer ISE. Philipp reported that, in the years leading up to 2024, tests often prompted astonished inquiries from module manufacturers when the determined values were lower than those measured on the production line. “In some cases, the manufacturers were obviously not aware of the extent of the problem,” he said. Of course, the manufacturers also have their own measured values checked and adjust their power measurements on the production line in a test laboratory.
Competition for clients
Is this a matter of willful ignorance? Manufacturers could have had an inkling of the problem. The fact that different laboratories have come to different conclusions has been a topic of discussion in the industry for some time, at least behind closed doors. However, some degree of deviation is natural.
Even the very best solar simulator has a certain measurement tolerance and there are other subtleties that can cause deviations in results. CalLab PV Modules, one of the few solar module calibration laboratories worldwide, regularly compares its measurements with those of the German National Metrology Institute (PTB). These comparisons, as well as occasional ones with other calibration labs, also reveal differences. Those differences, however, are always well below 1% and show a roughly equal amount of deviation in both the minus and plus ranges.
As of 2024, comparisons between the measurements carried out at Fraunhofer ISE with the reported rated power from manufacturers have demonstrated a significant and consistently increasing deviation of power output figures, going back several years, and always to more negative values.
There could be another explanation: If differences occur in the actual power output recorded by testing laboratories, of course, solar manufacturers could well act accordingly. A manufacturer that receives a certificate of 500 W for its module in laboratory A, but 510 W in laboratory B, may be inclined to switch to B – especially if its competitors do the same.
There are certainly signs of a counter movement among manufacturers. Philipp said that manufacturers are increasingly asking for references from Fraunhofer ISE to check results.
Even if smaller customers do not have the opportunity for follow-up checks, this could indicate a trend in a positive direction, as word could get around if a module manufacturer regularly attracted negative attention.
“We will continue to monitor developments,” Philipp said.
This content is protected by copyright and may not be reused. If you want to cooperate with us and would like to reuse some of our content, please contact: editors@pv-magazine.com.




By submitting this form you agree to pv magazine using your data for the purposes of publishing your comment.
Your personal data will only be disclosed or otherwise transmitted to third parties for the purposes of spam filtering or if this is necessary for technical maintenance of the website. Any other transfer to third parties will not take place unless this is justified on the basis of applicable data protection regulations or if pv magazine is legally obliged to do so.
You may revoke this consent at any time with effect for the future, in which case your personal data will be deleted immediately. Otherwise, your data will be deleted if pv magazine has processed your request or the purpose of data storage is fulfilled.
Further information on data privacy can be found in our Data Protection Policy.